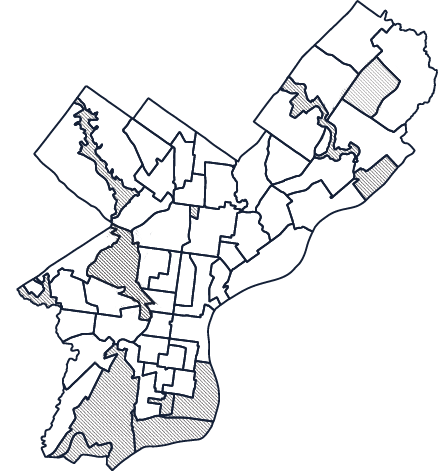
Hover on the map for a quick view of its health outcomes and health factors ranking.
For detailed information about each area, select a neighborhood:
Outcomes Rank:
/46
Factors Rank:
/46
Hover on the map for a quick view of its health outcomes and health factors ranking.
For detailed information about each area, select a neighborhood:
Outcomes Rank:
/46
Factors Rank:
/46
Health Outcomes Rank7/46
Health Factors Rank 7/46

Population31,990
Median Age44.9
Median Household Income$46,754
Life Expectancy, Men
72.3
Life Expectancy, Women
79.3
Poor Physical Health
13.7%
Poor Mental Health
14.6%
Low Birth Weight
10.8%
Adult Asthma
10.9%
Hypertension
32.9%
High Cholesterol
34.6%
Cancer
5.6%
Chronic Kidney Disease
3.0%
Chronic Obstructive Pulmonary Disease (COPD)
7.2%
Coronary Heart Disease
6.3%
Diabetes
12.2%
Stroke
4.0%
Adult Smoking
22.2%
Adult Obesity
30.6%
Residents >1/2 Mile from Supermaket
22.3%
Physically Inactive Adults
30.6%
Binge Drinking
17.9%
Drug Overdose Deaths (per 100,000 people)
44.8
Teen Births (per 1,000 females 15-19)
26
Uninsured
12.0%
Primary Care Physician Supply (residents per physician)
1460
Inadequate Prenatal Care
30.7%
Recent Routine Medical Checkup, Adults
74.9%
Core Preventative Services, Men 65+
29.0%
Core Preventative Services, Women 65+
28.7%
Mammography Screening
79.2%
Hypertension Medication Adherence
76.4%
Reading Proficiency (K-2)
45%
Completed Some College
49.1%
Unemployment
12.5%
Children in Poverty
36.7%
Income Inequality
-0.06
Single Parent Households
15.8%
Violent Crime (per 10,000 people)
95.7
Injury Deaths (per 100,00 people)
68.6
Homicides (per 10,000 people)
1.7
Housing Code Violations (per 1,000 housing units)
164.1
Driving Alone to Work
50.8%
Commute ≥ 60 Minutes
14.1%
Walk Score™
79.0
Vacant Buildings
2.4%
Health Outcomes Rank1/46
Health Factors Rank 2/46

Population29,382
Median Age30.7
Median Household Income$80,975
Life Expectancy, Men
72.3
Life Expectancy, Women
79.3
Poor Physical Health
13.7%
Poor Mental Health
14.6%
Low Birth Weight
10.8%
Adult Asthma
10.9%
Hypertension
32.9%
High Cholesterol
34.6%
Cancer
5.6%
Chronic Kidney Disease
3.0%
Chronic Obstructive Pulmonary Disease (COPD)
7.2%
Coronary Heart Disease
6.3%
Diabetes
12.2%
Stroke
4.0%
Adult Smoking
22.2%
Adult Obesity
30.6%
Residents >1/2 Mile from Supermaket
22.3%
Physically Inactive Adults
30.6%
Binge Drinking
17.9%
Drug Overdose Deaths (per 100,000 people)
44.8
Teen Births (per 1,000 females 15-19)
26
Uninsured
12.0%
Primary Care Physician Supply (residents per physician)
1460
Inadequate Prenatal Care
30.7%
Recent Routine Medical Checkup, Adults
74.9%
Core Preventative Services, Men 65+
29.0%
Core Preventative Services, Women 65+
28.7%
Mammography Screening
79.2%
Hypertension Medication Adherence
76.4%
Reading Proficiency (K-2)
45%
Completed Some College
49.1%
Unemployment
12.5%
Children in Poverty
36.7%
Income Inequality
-0.06
Single Parent Households
15.8%
Violent Crime (per 10,000 people)
95.7
Injury Deaths (per 100,00 people)
68.6
Homicides (per 10,000 people)
1.7
Housing Code Violations (per 1,000 housing units)
164.1
Driving Alone to Work
50.8%
Commute ≥ 60 Minutes
14.1%
Walk Score™
79.0
Vacant Buildings
2.4%
Health Outcomes Rank2/46
Health Factors Rank 1/46

Population31,136
Median Age32.8
Median Household Income$74,961
Life Expectancy, Men
72.3
Life Expectancy, Women
79.3
Poor Physical Health
13.7%
Poor Mental Health
14.6%
Low Birth Weight
10.8%
Adult Asthma
10.9%
Hypertension
32.9%
High Cholesterol
34.6%
Cancer
5.6%
Chronic Kidney Disease
3.0%
Chronic Obstructive Pulmonary Disease (COPD)
7.2%
Coronary Heart Disease
6.3%
Diabetes
12.2%
Stroke
4.0%
Adult Smoking
22.2%
Adult Obesity
30.6%
Residents >1/2 Mile from Supermaket
22.3%
Physically Inactive Adults
30.6%
Binge Drinking
17.9%
Drug Overdose Deaths (per 100,000 people)
44.8
Teen Births (per 1,000 females 15-19)
26
Uninsured
12.0%
Primary Care Physician Supply (residents per physician)
1460
Inadequate Prenatal Care
30.7%
Recent Routine Medical Checkup, Adults
74.9%
Core Preventative Services, Men 65+
29.0%
Core Preventative Services, Women 65+
28.7%
Mammography Screening
79.2%
Hypertension Medication Adherence
76.4%
Reading Proficiency (K-2)
45%
Completed Some College
49.1%
Unemployment
12.5%
Children in Poverty
36.7%
Income Inequality
-0.06
Single Parent Households
15.8%
Violent Crime (per 10,000 people)
95.7
Injury Deaths (per 100,00 people)
68.6
Homicides (per 10,000 people)
1.7
Housing Code Violations (per 1,000 housing units)
164.1
Driving Alone to Work
50.8%
Commute ≥ 60 Minutes
14.1%
Walk Score™
79.0
Vacant Buildings
2.4%
Health Outcomes Rank8/46
Health Factors Rank 3/46

Population25,197
Median Age43.6
Median Household Income$67,499
Life Expectancy, Men
72.3
Life Expectancy, Women
79.3
Poor Physical Health
13.7%
Poor Mental Health
14.6%
Low Birth Weight
10.8%
Adult Asthma
10.9%
Hypertension
32.9%
High Cholesterol
34.6%
Cancer
5.6%
Chronic Kidney Disease
3.0%
Chronic Obstructive Pulmonary Disease (COPD)
7.2%
Coronary Heart Disease
6.3%
Diabetes
12.2%
Stroke
4.0%
Adult Smoking
22.2%
Adult Obesity
30.6%
Residents >1/2 Mile from Supermaket
22.3%
Physically Inactive Adults
30.6%
Binge Drinking
17.9%
Drug Overdose Deaths (per 100,000 people)
44.8
Teen Births (per 1,000 females 15-19)
26
Uninsured
12.0%
Primary Care Physician Supply (residents per physician)
1460
Inadequate Prenatal Care
30.7%
Recent Routine Medical Checkup, Adults
74.9%
Core Preventative Services, Men 65+
29.0%
Core Preventative Services, Women 65+
28.7%
Mammography Screening
79.2%
Hypertension Medication Adherence
76.4%
Reading Proficiency (K-2)
45%
Completed Some College
49.1%
Unemployment
12.5%
Children in Poverty
36.7%
Income Inequality
-0.06
Single Parent Households
15.8%
Violent Crime (per 10,000 people)
95.7
Injury Deaths (per 100,00 people)
68.6
Homicides (per 10,000 people)
1.7
Housing Code Violations (per 1,000 housing units)
164.1
Driving Alone to Work
50.8%
Commute ≥ 60 Minutes
14.1%
Walk Score™
79.0
Vacant Buildings
2.4%
Health Outcomes Rank37/46
Health Factors Rank 34/46

Population39,503
Median Age34.3
Median Household Income$30,535
Life Expectancy, Men
72.3
Life Expectancy, Women
79.3
Poor Physical Health
13.7%
Poor Mental Health
14.6%
Low Birth Weight
10.8%
Adult Asthma
10.9%
Hypertension
32.9%
High Cholesterol
34.6%
Cancer
5.6%
Chronic Kidney Disease
3.0%
Chronic Obstructive Pulmonary Disease (COPD)
7.2%
Coronary Heart Disease
6.3%
Diabetes
12.2%
Stroke
4.0%
Adult Smoking
22.2%
Adult Obesity
30.6%
Residents >1/2 Mile from Supermaket
22.3%
Physically Inactive Adults
30.6%
Binge Drinking
17.9%
Drug Overdose Deaths (per 100,000 people)
44.8
Teen Births (per 1,000 females 15-19)
26
Uninsured
12.0%
Primary Care Physician Supply (residents per physician)
1460
Inadequate Prenatal Care
30.7%
Recent Routine Medical Checkup, Adults
74.9%
Core Preventative Services, Men 65+
29.0%
Core Preventative Services, Women 65+
28.7%
Mammography Screening
79.2%
Hypertension Medication Adherence
76.4%
Reading Proficiency (K-2)
45%
Completed Some College
49.1%
Unemployment
12.5%
Children in Poverty
36.7%
Income Inequality
-0.06
Single Parent Households
15.8%
Violent Crime (per 10,000 people)
95.7
Injury Deaths (per 100,00 people)
68.6
Homicides (per 10,000 people)
1.7
Housing Code Violations (per 1,000 housing units)
164.1
Driving Alone to Work
50.8%
Commute ≥ 60 Minutes
14.1%
Walk Score™
79.0
Vacant Buildings
2.4%
Health Outcomes Rank17/46
Health Factors Rank 13/46

Population19,008
Median Age32.0
Median Household Income$43,670
Life Expectancy, Men
72.3
Life Expectancy, Women
79.3
Poor Physical Health
13.7%
Poor Mental Health
14.6%
Low Birth Weight
10.8%
Adult Asthma
10.9%
Hypertension
32.9%
High Cholesterol
34.6%
Cancer
5.6%
Chronic Kidney Disease
3.0%
Chronic Obstructive Pulmonary Disease (COPD)
7.2%
Coronary Heart Disease
6.3%
Diabetes
12.2%
Stroke
4.0%
Adult Smoking
22.2%
Adult Obesity
30.6%
Residents >1/2 Mile from Supermaket
22.3%
Physically Inactive Adults
30.6%
Binge Drinking
17.9%
Drug Overdose Deaths (per 100,000 people)
44.8
Teen Births (per 1,000 females 15-19)
26
Uninsured
12.0%
Primary Care Physician Supply (residents per physician)
1460
Inadequate Prenatal Care
30.7%
Recent Routine Medical Checkup, Adults
74.9%
Core Preventative Services, Men 65+
29.0%
Core Preventative Services, Women 65+
28.7%
Mammography Screening
79.2%
Hypertension Medication Adherence
76.4%
Reading Proficiency (K-2)
45%
Completed Some College
49.1%
Unemployment
12.5%
Children in Poverty
36.7%
Income Inequality
-0.06
Single Parent Households
15.8%
Violent Crime (per 10,000 people)
95.7
Injury Deaths (per 100,00 people)
68.6
Homicides (per 10,000 people)
1.7
Housing Code Violations (per 1,000 housing units)
164.1
Driving Alone to Work
50.8%
Commute ≥ 60 Minutes
14.1%
Walk Score™
79.0
Vacant Buildings
2.4%
Health Outcomes Rank24/46
Health Factors Rank 20/46

Population24,405
Median Age43.9
Median Household Income$40,379
Life Expectancy, Men
72.3
Life Expectancy, Women
79.3
Poor Physical Health
13.7%
Poor Mental Health
14.6%
Low Birth Weight
10.8%
Adult Asthma
10.9%
Hypertension
32.9%
High Cholesterol
34.6%
Cancer
5.6%
Chronic Kidney Disease
3.0%
Chronic Obstructive Pulmonary Disease (COPD)
7.2%
Coronary Heart Disease
6.3%
Diabetes
12.2%
Stroke
4.0%
Adult Smoking
22.2%
Adult Obesity
30.6%
Residents >1/2 Mile from Supermaket
22.3%
Physically Inactive Adults
30.6%
Binge Drinking
17.9%
Drug Overdose Deaths (per 100,000 people)
44.8
Teen Births (per 1,000 females 15-19)
26
Uninsured
12.0%
Primary Care Physician Supply (residents per physician)
1460
Inadequate Prenatal Care
30.7%
Recent Routine Medical Checkup, Adults
74.9%
Core Preventative Services, Men 65+
29.0%
Core Preventative Services, Women 65+
28.7%
Mammography Screening
79.2%
Hypertension Medication Adherence
76.4%
Reading Proficiency (K-2)
45%
Completed Some College
49.1%
Unemployment
12.5%
Children in Poverty
36.7%
Income Inequality
-0.06
Single Parent Households
15.8%
Violent Crime (per 10,000 people)
95.7
Injury Deaths (per 100,00 people)
68.6
Homicides (per 10,000 people)
1.7
Housing Code Violations (per 1,000 housing units)
164.1
Driving Alone to Work
50.8%
Commute ≥ 60 Minutes
14.1%
Walk Score™
79.0
Vacant Buildings
2.4%
Health Outcomes Rank28/46
Health Factors Rank 28/46

Population30,125
Median Age35.8
Median Household Income$33,894
Life Expectancy, Men
72.3
Life Expectancy, Women
79.3
Poor Physical Health
13.7%
Poor Mental Health
14.6%
Low Birth Weight
10.8%
Adult Asthma
10.9%
Hypertension
32.9%
High Cholesterol
34.6%
Cancer
5.6%
Chronic Kidney Disease
3.0%
Chronic Obstructive Pulmonary Disease (COPD)
7.2%
Coronary Heart Disease
6.3%
Diabetes
12.2%
Stroke
4.0%
Adult Smoking
22.2%
Adult Obesity
30.6%
Residents >1/2 Mile from Supermaket
22.3%
Physically Inactive Adults
30.6%
Binge Drinking
17.9%
Drug Overdose Deaths (per 100,000 people)
44.8
Teen Births (per 1,000 females 15-19)
26
Uninsured
12.0%
Primary Care Physician Supply (residents per physician)
1460
Inadequate Prenatal Care
30.7%
Recent Routine Medical Checkup, Adults
74.9%
Core Preventative Services, Men 65+
29.0%
Core Preventative Services, Women 65+
28.7%
Mammography Screening
79.2%
Hypertension Medication Adherence
76.4%
Reading Proficiency (K-2)
45%
Completed Some College
49.1%
Unemployment
12.5%
Children in Poverty
36.7%
Income Inequality
-0.06
Single Parent Households
15.8%
Violent Crime (per 10,000 people)
95.7
Injury Deaths (per 100,00 people)
68.6
Homicides (per 10,000 people)
1.7
Housing Code Violations (per 1,000 housing units)
164.1
Driving Alone to Work
50.8%
Commute ≥ 60 Minutes
14.1%
Walk Score™
79.0
Vacant Buildings
2.4%
Health Outcomes Rank9/46
Health Factors Rank 4/46

Population24,379
Median Age31.8
Median Household Income$74,442
Life Expectancy, Men
72.3
Life Expectancy, Women
79.3
Poor Physical Health
13.7%
Poor Mental Health
14.6%
Low Birth Weight
10.8%
Adult Asthma
10.9%
Hypertension
32.9%
High Cholesterol
34.6%
Cancer
5.6%
Chronic Kidney Disease
3.0%
Chronic Obstructive Pulmonary Disease (COPD)
7.2%
Coronary Heart Disease
6.3%
Diabetes
12.2%
Stroke
4.0%
Adult Smoking
22.2%
Adult Obesity
30.6%
Residents >1/2 Mile from Supermaket
22.3%
Physically Inactive Adults
30.6%
Binge Drinking
17.9%
Drug Overdose Deaths (per 100,000 people)
44.8
Teen Births (per 1,000 females 15-19)
26
Uninsured
12.0%
Primary Care Physician Supply (residents per physician)
1460
Inadequate Prenatal Care
30.7%
Recent Routine Medical Checkup, Adults
74.9%
Core Preventative Services, Men 65+
29.0%
Core Preventative Services, Women 65+
28.7%
Mammography Screening
79.2%
Hypertension Medication Adherence
76.4%
Reading Proficiency (K-2)
45%
Completed Some College
49.1%
Unemployment
12.5%
Children in Poverty
36.7%
Income Inequality
-0.06
Single Parent Households
15.8%
Violent Crime (per 10,000 people)
95.7
Injury Deaths (per 100,00 people)
68.6
Homicides (per 10,000 people)
1.7
Housing Code Violations (per 1,000 housing units)
164.1
Driving Alone to Work
50.8%
Commute ≥ 60 Minutes
14.1%
Walk Score™
79.0
Vacant Buildings
2.4%
Health Outcomes Rank42/46
Health Factors Rank 43/46

Population33,351
Median Age30.8
Median Household Income$28,517
Life Expectancy, Men
72.3
Life Expectancy, Women
79.3
Poor Physical Health
13.7%
Poor Mental Health
14.6%
Low Birth Weight
10.8%
Adult Asthma
10.9%
Hypertension
32.9%
High Cholesterol
34.6%
Cancer
5.6%
Chronic Kidney Disease
3.0%
Chronic Obstructive Pulmonary Disease (COPD)
7.2%
Coronary Heart Disease
6.3%
Diabetes
12.2%
Stroke
4.0%
Adult Smoking
22.2%
Adult Obesity
30.6%
Residents >1/2 Mile from Supermaket
22.3%
Physically Inactive Adults
30.6%
Binge Drinking
17.9%
Drug Overdose Deaths (per 100,000 people)
44.8
Teen Births (per 1,000 females 15-19)
26
Uninsured
12.0%
Primary Care Physician Supply (residents per physician)
1460
Inadequate Prenatal Care
30.7%
Recent Routine Medical Checkup, Adults
74.9%
Core Preventative Services, Men 65+
29.0%
Core Preventative Services, Women 65+
28.7%
Mammography Screening
79.2%
Hypertension Medication Adherence
76.4%
Reading Proficiency (K-2)
45%
Completed Some College
49.1%
Unemployment
12.5%
Children in Poverty
36.7%
Income Inequality
-0.06
Single Parent Households
15.8%
Violent Crime (per 10,000 people)
95.7
Injury Deaths (per 100,00 people)
68.6
Homicides (per 10,000 people)
1.7
Housing Code Violations (per 1,000 housing units)
164.1
Driving Alone to Work
50.8%
Commute ≥ 60 Minutes
14.1%
Walk Score™
79.0
Vacant Buildings
2.4%
Health Outcomes Rank36/46
Health Factors Rank 36/46

Population24,938
Median Age34.4
Median Household Income$21,508
Life Expectancy, Men
72.3
Life Expectancy, Women
79.3
Poor Physical Health
13.7%
Poor Mental Health
14.6%
Low Birth Weight
10.8%
Adult Asthma
10.9%
Hypertension
32.9%
High Cholesterol
34.6%
Cancer
5.6%
Chronic Kidney Disease
3.0%
Chronic Obstructive Pulmonary Disease (COPD)
7.2%
Coronary Heart Disease
6.3%
Diabetes
12.2%
Stroke
4.0%
Adult Smoking
22.2%
Adult Obesity
30.6%
Residents >1/2 Mile from Supermaket
22.3%
Physically Inactive Adults
30.6%
Binge Drinking
17.9%
Drug Overdose Deaths (per 100,000 people)
44.8
Teen Births (per 1,000 females 15-19)
26
Uninsured
12.0%
Primary Care Physician Supply (residents per physician)
1460
Inadequate Prenatal Care
30.7%
Recent Routine Medical Checkup, Adults
74.9%
Core Preventative Services, Men 65+
29.0%
Core Preventative Services, Women 65+
28.7%
Mammography Screening
79.2%
Hypertension Medication Adherence
76.4%
Reading Proficiency (K-2)
45%
Completed Some College
49.1%
Unemployment
12.5%
Children in Poverty
36.7%
Income Inequality
-0.06
Single Parent Households
15.8%
Violent Crime (per 10,000 people)
95.7
Injury Deaths (per 100,00 people)
68.6
Homicides (per 10,000 people)
1.7
Housing Code Violations (per 1,000 housing units)
164.1
Driving Alone to Work
50.8%
Commute ≥ 60 Minutes
14.1%
Walk Score™
79.0
Vacant Buildings
2.4%
Health Outcomes Rank22/46
Health Factors Rank 23/46

Population23,087
Median Age38.7
Median Household Income$35,052
Life Expectancy, Men
72.3
Life Expectancy, Women
79.3
Poor Physical Health
13.7%
Poor Mental Health
14.6%
Low Birth Weight
10.8%
Adult Asthma
10.9%
Hypertension
32.9%
High Cholesterol
34.6%
Cancer
5.6%
Chronic Kidney Disease
3.0%
Chronic Obstructive Pulmonary Disease (COPD)
7.2%
Coronary Heart Disease
6.3%
Diabetes
12.2%
Stroke
4.0%
Adult Smoking
22.2%
Adult Obesity
30.6%
Residents >1/2 Mile from Supermaket
22.3%
Physically Inactive Adults
30.6%
Binge Drinking
17.9%
Drug Overdose Deaths (per 100,000 people)
44.8
Teen Births (per 1,000 females 15-19)
26
Uninsured
12.0%
Primary Care Physician Supply (residents per physician)
1460
Inadequate Prenatal Care
30.7%
Recent Routine Medical Checkup, Adults
74.9%
Core Preventative Services, Men 65+
29.0%
Core Preventative Services, Women 65+
28.7%
Mammography Screening
79.2%
Hypertension Medication Adherence
76.4%
Reading Proficiency (K-2)
45%
Completed Some College
49.1%
Unemployment
12.5%
Children in Poverty
36.7%
Income Inequality
-0.06
Single Parent Households
15.8%
Violent Crime (per 10,000 people)
95.7
Injury Deaths (per 100,00 people)
68.6
Homicides (per 10,000 people)
1.7
Housing Code Violations (per 1,000 housing units)
164.1
Driving Alone to Work
50.8%
Commute ≥ 60 Minutes
14.1%
Walk Score™
79.0
Vacant Buildings
2.4%
Health Outcomes Rank38/46
Health Factors Rank 31/46

Population49,972
Median Age34.6
Median Household Income$29,291
Life Expectancy, Men
72.3
Life Expectancy, Women
79.3
Poor Physical Health
13.7%
Poor Mental Health
14.6%
Low Birth Weight
10.8%
Adult Asthma
10.9%
Hypertension
32.9%
High Cholesterol
34.6%
Cancer
5.6%
Chronic Kidney Disease
3.0%
Chronic Obstructive Pulmonary Disease (COPD)
7.2%
Coronary Heart Disease
6.3%
Diabetes
12.2%
Stroke
4.0%
Adult Smoking
22.2%
Adult Obesity
30.6%
Residents >1/2 Mile from Supermaket
22.3%
Physically Inactive Adults
30.6%
Binge Drinking
17.9%
Drug Overdose Deaths (per 100,000 people)
44.8
Teen Births (per 1,000 females 15-19)
26
Uninsured
12.0%
Primary Care Physician Supply (residents per physician)
1460
Inadequate Prenatal Care
30.7%
Recent Routine Medical Checkup, Adults
74.9%
Core Preventative Services, Men 65+
29.0%
Core Preventative Services, Women 65+
28.7%
Mammography Screening
79.2%
Hypertension Medication Adherence
76.4%
Reading Proficiency (K-2)
45%
Completed Some College
49.1%
Unemployment
12.5%
Children in Poverty
36.7%
Income Inequality
-0.06
Single Parent Households
15.8%
Violent Crime (per 10,000 people)
95.7
Injury Deaths (per 100,00 people)
68.6
Homicides (per 10,000 people)
1.7
Housing Code Violations (per 1,000 housing units)
164.1
Driving Alone to Work
50.8%
Commute ≥ 60 Minutes
14.1%
Walk Score™
79.0
Vacant Buildings
2.4%
Health Outcomes Rank34/46
Health Factors Rank 45/46

Population53,206
Median Age29.3
Median Household Income$18,955
Life Expectancy, Men
72.3
Life Expectancy, Women
79.3
Poor Physical Health
13.7%
Poor Mental Health
14.6%
Low Birth Weight
10.8%
Adult Asthma
10.9%
Hypertension
32.9%
High Cholesterol
34.6%
Cancer
5.6%
Chronic Kidney Disease
3.0%
Chronic Obstructive Pulmonary Disease (COPD)
7.2%
Coronary Heart Disease
6.3%
Diabetes
12.2%
Stroke
4.0%
Adult Smoking
22.2%
Adult Obesity
30.6%
Residents >1/2 Mile from Supermaket
22.3%
Physically Inactive Adults
30.6%
Binge Drinking
17.9%
Drug Overdose Deaths (per 100,000 people)
44.8
Teen Births (per 1,000 females 15-19)
26
Uninsured
12.0%
Primary Care Physician Supply (residents per physician)
1460
Inadequate Prenatal Care
30.7%
Recent Routine Medical Checkup, Adults
74.9%
Core Preventative Services, Men 65+
29.0%
Core Preventative Services, Women 65+
28.7%
Mammography Screening
79.2%
Hypertension Medication Adherence
76.4%
Reading Proficiency (K-2)
45%
Completed Some College
49.1%
Unemployment
12.5%
Children in Poverty
36.7%
Income Inequality
-0.06
Single Parent Households
15.8%
Violent Crime (per 10,000 people)
95.7
Injury Deaths (per 100,00 people)
68.6
Homicides (per 10,000 people)
1.7
Housing Code Violations (per 1,000 housing units)
164.1
Driving Alone to Work
50.8%
Commute ≥ 60 Minutes
14.1%
Walk Score™
79.0
Vacant Buildings
2.4%
Health Outcomes Rank32/46
Health Factors Rank 44/46

Population37,989
Median Age25.6
Median Household Income$27,461
Life Expectancy, Men
72.3
Life Expectancy, Women
79.3
Poor Physical Health
13.7%
Poor Mental Health
14.6%
Low Birth Weight
10.8%
Adult Asthma
10.9%
Hypertension
32.9%
High Cholesterol
34.6%
Cancer
5.6%
Chronic Kidney Disease
3.0%
Chronic Obstructive Pulmonary Disease (COPD)
7.2%
Coronary Heart Disease
6.3%
Diabetes
12.2%
Stroke
4.0%
Adult Smoking
22.2%
Adult Obesity
30.6%
Residents >1/2 Mile from Supermaket
22.3%
Physically Inactive Adults
30.6%
Binge Drinking
17.9%
Drug Overdose Deaths (per 100,000 people)
44.8
Teen Births (per 1,000 females 15-19)
26
Uninsured
12.0%
Primary Care Physician Supply (residents per physician)
1460
Inadequate Prenatal Care
30.7%
Recent Routine Medical Checkup, Adults
74.9%
Core Preventative Services, Men 65+
29.0%
Core Preventative Services, Women 65+
28.7%
Mammography Screening
79.2%
Hypertension Medication Adherence
76.4%
Reading Proficiency (K-2)
45%
Completed Some College
49.1%
Unemployment
12.5%
Children in Poverty
36.7%
Income Inequality
-0.06
Single Parent Households
15.8%
Violent Crime (per 10,000 people)
95.7
Injury Deaths (per 100,00 people)
68.6
Homicides (per 10,000 people)
1.7
Housing Code Violations (per 1,000 housing units)
164.1
Driving Alone to Work
50.8%
Commute ≥ 60 Minutes
14.1%
Walk Score™
79.0
Vacant Buildings
2.4%
Health Outcomes Rank31/46
Health Factors Rank 32/46

Population43,303
Median Age29.8
Median Household Income$37,775
Life Expectancy, Men
72.3
Life Expectancy, Women
79.3
Poor Physical Health
13.7%
Poor Mental Health
14.6%
Low Birth Weight
10.8%
Adult Asthma
10.9%
Hypertension
32.9%
High Cholesterol
34.6%
Cancer
5.6%
Chronic Kidney Disease
3.0%
Chronic Obstructive Pulmonary Disease (COPD)
7.2%
Coronary Heart Disease
6.3%
Diabetes
12.2%
Stroke
4.0%
Adult Smoking
22.2%
Adult Obesity
30.6%
Residents >1/2 Mile from Supermaket
22.3%
Physically Inactive Adults
30.6%
Binge Drinking
17.9%
Drug Overdose Deaths (per 100,000 people)
44.8
Teen Births (per 1,000 females 15-19)
26
Uninsured
12.0%
Primary Care Physician Supply (residents per physician)
1460
Inadequate Prenatal Care
30.7%
Recent Routine Medical Checkup, Adults
74.9%
Core Preventative Services, Men 65+
29.0%
Core Preventative Services, Women 65+
28.7%
Mammography Screening
79.2%
Hypertension Medication Adherence
76.4%
Reading Proficiency (K-2)
45%
Completed Some College
49.1%
Unemployment
12.5%
Children in Poverty
36.7%
Income Inequality
-0.06
Single Parent Households
15.8%
Violent Crime (per 10,000 people)
95.7
Injury Deaths (per 100,00 people)
68.6
Homicides (per 10,000 people)
1.7
Housing Code Violations (per 1,000 housing units)
164.1
Driving Alone to Work
50.8%
Commute ≥ 60 Minutes
14.1%
Walk Score™
79.0
Vacant Buildings
2.4%
Health Outcomes Rank35/46
Health Factors Rank 38/46

Population25,264
Median Age31.7
Median Household Income$26,906
Life Expectancy, Men
72.3
Life Expectancy, Women
79.3
Poor Physical Health
13.7%
Poor Mental Health
14.6%
Low Birth Weight
10.8%
Adult Asthma
10.9%
Hypertension
32.9%
High Cholesterol
34.6%
Cancer
5.6%
Chronic Kidney Disease
3.0%
Chronic Obstructive Pulmonary Disease (COPD)
7.2%
Coronary Heart Disease
6.3%
Diabetes
12.2%
Stroke
4.0%
Adult Smoking
22.2%
Adult Obesity
30.6%
Residents >1/2 Mile from Supermaket
22.3%
Physically Inactive Adults
30.6%
Binge Drinking
17.9%
Drug Overdose Deaths (per 100,000 people)
44.8
Teen Births (per 1,000 females 15-19)
26
Uninsured
12.0%
Primary Care Physician Supply (residents per physician)
1460
Inadequate Prenatal Care
30.7%
Recent Routine Medical Checkup, Adults
74.9%
Core Preventative Services, Men 65+
29.0%
Core Preventative Services, Women 65+
28.7%
Mammography Screening
79.2%
Hypertension Medication Adherence
76.4%
Reading Proficiency (K-2)
45%
Completed Some College
49.1%
Unemployment
12.5%
Children in Poverty
36.7%
Income Inequality
-0.06
Single Parent Households
15.8%
Violent Crime (per 10,000 people)
95.7
Injury Deaths (per 100,00 people)
68.6
Homicides (per 10,000 people)
1.7
Housing Code Violations (per 1,000 housing units)
164.1
Driving Alone to Work
50.8%
Commute ≥ 60 Minutes
14.1%
Walk Score™
79.0
Vacant Buildings
2.4%
Health Outcomes Rank14/46
Health Factors Rank 19/46

Population20,577
Median Age33.2
Median Household Income$52,576
Life Expectancy, Men
72.3
Life Expectancy, Women
79.3
Poor Physical Health
13.7%
Poor Mental Health
14.6%
Low Birth Weight
10.8%
Adult Asthma
10.9%
Hypertension
32.9%
High Cholesterol
34.6%
Cancer
5.6%
Chronic Kidney Disease
3.0%
Chronic Obstructive Pulmonary Disease (COPD)
7.2%
Coronary Heart Disease
6.3%
Diabetes
12.2%
Stroke
4.0%
Adult Smoking
22.2%
Adult Obesity
30.6%
Residents >1/2 Mile from Supermaket
22.3%
Physically Inactive Adults
30.6%
Binge Drinking
17.9%
Drug Overdose Deaths (per 100,000 people)
44.8
Teen Births (per 1,000 females 15-19)
26
Uninsured
12.0%
Primary Care Physician Supply (residents per physician)
1460
Inadequate Prenatal Care
30.7%
Recent Routine Medical Checkup, Adults
74.9%
Core Preventative Services, Men 65+
29.0%
Core Preventative Services, Women 65+
28.7%
Mammography Screening
79.2%
Hypertension Medication Adherence
76.4%
Reading Proficiency (K-2)
45%
Completed Some College
49.1%
Unemployment
12.5%
Children in Poverty
36.7%
Income Inequality
-0.06
Single Parent Households
15.8%
Violent Crime (per 10,000 people)
95.7
Injury Deaths (per 100,00 people)
68.6
Homicides (per 10,000 people)
1.7
Housing Code Violations (per 1,000 housing units)
164.1
Driving Alone to Work
50.8%
Commute ≥ 60 Minutes
14.1%
Walk Score™
79.0
Vacant Buildings
2.4%
Health Outcomes Rank19/46
Health Factors Rank 24/46

Population52,369
Median Age34.6
Median Household Income$40,294
Life Expectancy, Men
72.3
Life Expectancy, Women
79.3
Poor Physical Health
13.7%
Poor Mental Health
14.6%
Low Birth Weight
10.8%
Adult Asthma
10.9%
Hypertension
32.9%
High Cholesterol
34.6%
Cancer
5.6%
Chronic Kidney Disease
3.0%
Chronic Obstructive Pulmonary Disease (COPD)
7.2%
Coronary Heart Disease
6.3%
Diabetes
12.2%
Stroke
4.0%
Adult Smoking
22.2%
Adult Obesity
30.6%
Residents >1/2 Mile from Supermaket
22.3%
Physically Inactive Adults
30.6%
Binge Drinking
17.9%
Drug Overdose Deaths (per 100,000 people)
44.8
Teen Births (per 1,000 females 15-19)
26
Uninsured
12.0%
Primary Care Physician Supply (residents per physician)
1460
Inadequate Prenatal Care
30.7%
Recent Routine Medical Checkup, Adults
74.9%
Core Preventative Services, Men 65+
29.0%
Core Preventative Services, Women 65+
28.7%
Mammography Screening
79.2%
Hypertension Medication Adherence
76.4%
Reading Proficiency (K-2)
45%
Completed Some College
49.1%
Unemployment
12.5%
Children in Poverty
36.7%
Income Inequality
-0.06
Single Parent Households
15.8%
Violent Crime (per 10,000 people)
95.7
Injury Deaths (per 100,00 people)
68.6
Homicides (per 10,000 people)
1.7
Housing Code Violations (per 1,000 housing units)
164.1
Driving Alone to Work
50.8%
Commute ≥ 60 Minutes
14.1%
Walk Score™
79.0
Vacant Buildings
2.4%
Health Outcomes Rank43/46
Health Factors Rank 39/46

Population33,549
Median Age32.2
Median Household Income$19,822
Life Expectancy, Men
72.3
Life Expectancy, Women
79.3
Poor Physical Health
13.7%
Poor Mental Health
14.6%
Low Birth Weight
10.8%
Adult Asthma
10.9%
Hypertension
32.9%
High Cholesterol
34.6%
Cancer
5.6%
Chronic Kidney Disease
3.0%
Chronic Obstructive Pulmonary Disease (COPD)
7.2%
Coronary Heart Disease
6.3%
Diabetes
12.2%
Stroke
4.0%
Adult Smoking
22.2%
Adult Obesity
30.6%
Residents >1/2 Mile from Supermaket
22.3%
Physically Inactive Adults
30.6%
Binge Drinking
17.9%
Drug Overdose Deaths (per 100,000 people)
44.8
Teen Births (per 1,000 females 15-19)
26
Uninsured
12.0%
Primary Care Physician Supply (residents per physician)
1460
Inadequate Prenatal Care
30.7%
Recent Routine Medical Checkup, Adults
74.9%
Core Preventative Services, Men 65+
29.0%
Core Preventative Services, Women 65+
28.7%
Mammography Screening
79.2%
Hypertension Medication Adherence
76.4%
Reading Proficiency (K-2)
45%
Completed Some College
49.1%
Unemployment
12.5%
Children in Poverty
36.7%
Income Inequality
-0.06
Single Parent Households
15.8%
Violent Crime (per 10,000 people)
95.7
Injury Deaths (per 100,00 people)
68.6
Homicides (per 10,000 people)
1.7
Housing Code Violations (per 1,000 housing units)
164.1
Driving Alone to Work
50.8%
Commute ≥ 60 Minutes
14.1%
Walk Score™
79.0
Vacant Buildings
2.4%
Health Outcomes Rank45/46
Health Factors Rank 41/46

Population36,992
Median Age35.7
Median Household Income$24,655
Life Expectancy, Men
72.3
Life Expectancy, Women
79.3
Poor Physical Health
13.7%
Poor Mental Health
14.6%
Low Birth Weight
10.8%
Adult Asthma
10.9%
Hypertension
32.9%
High Cholesterol
34.6%
Cancer
5.6%
Chronic Kidney Disease
3.0%
Chronic Obstructive Pulmonary Disease (COPD)
7.2%
Coronary Heart Disease
6.3%
Diabetes
12.2%
Stroke
4.0%
Adult Smoking
22.2%
Adult Obesity
30.6%
Residents >1/2 Mile from Supermaket
22.3%
Physically Inactive Adults
30.6%
Binge Drinking
17.9%
Drug Overdose Deaths (per 100,000 people)
44.8
Teen Births (per 1,000 females 15-19)
26
Uninsured
12.0%
Primary Care Physician Supply (residents per physician)
1460
Inadequate Prenatal Care
30.7%
Recent Routine Medical Checkup, Adults
74.9%
Core Preventative Services, Men 65+
29.0%
Core Preventative Services, Women 65+
28.7%
Mammography Screening
79.2%
Hypertension Medication Adherence
76.4%
Reading Proficiency (K-2)
45%
Completed Some College
49.1%
Unemployment
12.5%
Children in Poverty
36.7%
Income Inequality
-0.06
Single Parent Households
15.8%
Violent Crime (per 10,000 people)
95.7
Injury Deaths (per 100,00 people)
68.6
Homicides (per 10,000 people)
1.7
Housing Code Violations (per 1,000 housing units)
164.1
Driving Alone to Work
50.8%
Commute ≥ 60 Minutes
14.1%
Walk Score™
79.0
Vacant Buildings
2.4%
Health Outcomes Rank26/46
Health Factors Rank 27/46

Population28,983
Median Age31.2
Median Household Income$47,579
Life Expectancy, Men
72.3
Life Expectancy, Women
79.3
Poor Physical Health
13.7%
Poor Mental Health
14.6%
Low Birth Weight
10.8%
Adult Asthma
10.9%
Hypertension
32.9%
High Cholesterol
34.6%
Cancer
5.6%
Chronic Kidney Disease
3.0%
Chronic Obstructive Pulmonary Disease (COPD)
7.2%
Coronary Heart Disease
6.3%
Diabetes
12.2%
Stroke
4.0%
Adult Smoking
22.2%
Adult Obesity
30.6%
Residents >1/2 Mile from Supermaket
22.3%
Physically Inactive Adults
30.6%
Binge Drinking
17.9%
Drug Overdose Deaths (per 100,000 people)
44.8
Teen Births (per 1,000 females 15-19)
26
Uninsured
12.0%
Primary Care Physician Supply (residents per physician)
1460
Inadequate Prenatal Care
30.7%
Recent Routine Medical Checkup, Adults
74.9%
Core Preventative Services, Men 65+
29.0%
Core Preventative Services, Women 65+
28.7%
Mammography Screening
79.2%
Hypertension Medication Adherence
76.4%
Reading Proficiency (K-2)
45%
Completed Some College
49.1%
Unemployment
12.5%
Children in Poverty
36.7%
Income Inequality
-0.06
Single Parent Households
15.8%
Violent Crime (per 10,000 people)
95.7
Injury Deaths (per 100,00 people)
68.6
Homicides (per 10,000 people)
1.7
Housing Code Violations (per 1,000 housing units)
164.1
Driving Alone to Work
50.8%
Commute ≥ 60 Minutes
14.1%
Walk Score™
79.0
Vacant Buildings
2.4%
Health Outcomes Rank25/46
Health Factors Rank 21/46

Population21,497
Median Age37.8
Median Household Income$41,312
Life Expectancy, Men
72.3
Life Expectancy, Women
79.3
Poor Physical Health
13.7%
Poor Mental Health
14.6%
Low Birth Weight
10.8%
Adult Asthma
10.9%
Hypertension
32.9%
High Cholesterol
34.6%
Cancer
5.6%
Chronic Kidney Disease
3.0%
Chronic Obstructive Pulmonary Disease (COPD)
7.2%
Coronary Heart Disease
6.3%
Diabetes
12.2%
Stroke
4.0%
Adult Smoking
22.2%
Adult Obesity
30.6%
Residents >1/2 Mile from Supermaket
22.3%
Physically Inactive Adults
30.6%
Binge Drinking
17.9%
Drug Overdose Deaths (per 100,000 people)
44.8
Teen Births (per 1,000 females 15-19)
26
Uninsured
12.0%
Primary Care Physician Supply (residents per physician)
1460
Inadequate Prenatal Care
30.7%
Recent Routine Medical Checkup, Adults
74.9%
Core Preventative Services, Men 65+
29.0%
Core Preventative Services, Women 65+
28.7%
Mammography Screening
79.2%
Hypertension Medication Adherence
76.4%
Reading Proficiency (K-2)
45%
Completed Some College
49.1%
Unemployment
12.5%
Children in Poverty
36.7%
Income Inequality
-0.06
Single Parent Households
15.8%
Violent Crime (per 10,000 people)
95.7
Injury Deaths (per 100,00 people)
68.6
Homicides (per 10,000 people)
1.7
Housing Code Violations (per 1,000 housing units)
164.1
Driving Alone to Work
50.8%
Commute ≥ 60 Minutes
14.1%
Walk Score™
79.0
Vacant Buildings
2.4%
Health Outcomes Rank41/46
Health Factors Rank 26/46

Population28,843
Median Age36.9
Median Household Income$28,946
Life Expectancy, Men
72.3
Life Expectancy, Women
79.3
Poor Physical Health
13.7%
Poor Mental Health
14.6%
Low Birth Weight
10.8%
Adult Asthma
10.9%
Hypertension
32.9%
High Cholesterol
34.6%
Cancer
5.6%
Chronic Kidney Disease
3.0%
Chronic Obstructive Pulmonary Disease (COPD)
7.2%
Coronary Heart Disease
6.3%
Diabetes
12.2%
Stroke
4.0%
Adult Smoking
22.2%
Adult Obesity
30.6%
Residents >1/2 Mile from Supermaket
22.3%
Physically Inactive Adults
30.6%
Binge Drinking
17.9%
Drug Overdose Deaths (per 100,000 people)
44.8
Teen Births (per 1,000 females 15-19)
26
Uninsured
12.0%
Primary Care Physician Supply (residents per physician)
1460
Inadequate Prenatal Care
30.7%
Recent Routine Medical Checkup, Adults
74.9%
Core Preventative Services, Men 65+
29.0%
Core Preventative Services, Women 65+
28.7%
Mammography Screening
79.2%
Hypertension Medication Adherence
76.4%
Reading Proficiency (K-2)
45%
Completed Some College
49.1%
Unemployment
12.5%
Children in Poverty
36.7%
Income Inequality
-0.06
Single Parent Households
15.8%
Violent Crime (per 10,000 people)
95.7
Injury Deaths (per 100,00 people)
68.6
Homicides (per 10,000 people)
1.7
Housing Code Violations (per 1,000 housing units)
164.1
Driving Alone to Work
50.8%
Commute ≥ 60 Minutes
14.1%
Walk Score™
79.0
Vacant Buildings
2.4%
Health Outcomes Rank29/46
Health Factors Rank 35/46

Population54,106
Median Age28.0
Median Household Income$35,800
Life Expectancy, Men
72.3
Life Expectancy, Women
79.3
Poor Physical Health
13.7%
Poor Mental Health
14.6%
Low Birth Weight
10.8%
Adult Asthma
10.9%
Hypertension
32.9%
High Cholesterol
34.6%
Cancer
5.6%
Chronic Kidney Disease
3.0%
Chronic Obstructive Pulmonary Disease (COPD)
7.2%
Coronary Heart Disease
6.3%
Diabetes
12.2%
Stroke
4.0%
Adult Smoking
22.2%
Adult Obesity
30.6%
Residents >1/2 Mile from Supermaket
22.3%
Physically Inactive Adults
30.6%
Binge Drinking
17.9%
Drug Overdose Deaths (per 100,000 people)
44.8
Teen Births (per 1,000 females 15-19)
26
Uninsured
12.0%
Primary Care Physician Supply (residents per physician)
1460
Inadequate Prenatal Care
30.7%
Recent Routine Medical Checkup, Adults
74.9%
Core Preventative Services, Men 65+
29.0%
Core Preventative Services, Women 65+
28.7%
Mammography Screening
79.2%
Hypertension Medication Adherence
76.4%
Reading Proficiency (K-2)
45%
Completed Some College
49.1%
Unemployment
12.5%
Children in Poverty
36.7%
Income Inequality
-0.06
Single Parent Households
15.8%
Violent Crime (per 10,000 people)
95.7
Injury Deaths (per 100,00 people)
68.6
Homicides (per 10,000 people)
1.7
Housing Code Violations (per 1,000 housing units)
164.1
Driving Alone to Work
50.8%
Commute ≥ 60 Minutes
14.1%
Walk Score™
79.0
Vacant Buildings
2.4%
Health Outcomes Rank20/46
Health Factors Rank 16/46

Population37,688
Median Age41.2
Median Household Income$38,294
Life Expectancy, Men
72.3
Life Expectancy, Women
79.3
Poor Physical Health
13.7%
Poor Mental Health
14.6%
Low Birth Weight
10.8%
Adult Asthma
10.9%
Hypertension
32.9%
High Cholesterol
34.6%
Cancer
5.6%
Chronic Kidney Disease
3.0%
Chronic Obstructive Pulmonary Disease (COPD)
7.2%
Coronary Heart Disease
6.3%
Diabetes
12.2%
Stroke
4.0%
Adult Smoking
22.2%
Adult Obesity
30.6%
Residents >1/2 Mile from Supermaket
22.3%
Physically Inactive Adults
30.6%
Binge Drinking
17.9%
Drug Overdose Deaths (per 100,000 people)
44.8
Teen Births (per 1,000 females 15-19)
26
Uninsured
12.0%
Primary Care Physician Supply (residents per physician)
1460
Inadequate Prenatal Care
30.7%
Recent Routine Medical Checkup, Adults
74.9%
Core Preventative Services, Men 65+
29.0%
Core Preventative Services, Women 65+
28.7%
Mammography Screening
79.2%
Hypertension Medication Adherence
76.4%
Reading Proficiency (K-2)
45%
Completed Some College
49.1%
Unemployment
12.5%
Children in Poverty
36.7%
Income Inequality
-0.06
Single Parent Households
15.8%
Violent Crime (per 10,000 people)
95.7
Injury Deaths (per 100,00 people)
68.6
Homicides (per 10,000 people)
1.7
Housing Code Violations (per 1,000 housing units)
164.1
Driving Alone to Work
50.8%
Commute ≥ 60 Minutes
14.1%
Walk Score™
79.0
Vacant Buildings
2.4%
Health Outcomes Rank11/46
Health Factors Rank 25/46

Population51,974
Median Age30.6
Median Household Income$37,659
Life Expectancy, Men
72.3
Life Expectancy, Women
79.3
Poor Physical Health
13.7%
Poor Mental Health
14.6%
Low Birth Weight
10.8%
Adult Asthma
10.9%
Hypertension
32.9%
High Cholesterol
34.6%
Cancer
5.6%
Chronic Kidney Disease
3.0%
Chronic Obstructive Pulmonary Disease (COPD)
7.2%
Coronary Heart Disease
6.3%
Diabetes
12.2%
Stroke
4.0%
Adult Smoking
22.2%
Adult Obesity
30.6%
Residents >1/2 Mile from Supermaket
22.3%
Physically Inactive Adults
30.6%
Binge Drinking
17.9%
Drug Overdose Deaths (per 100,000 people)
44.8
Teen Births (per 1,000 females 15-19)
26
Uninsured
12.0%
Primary Care Physician Supply (residents per physician)
1460
Inadequate Prenatal Care
30.7%
Recent Routine Medical Checkup, Adults
74.9%
Core Preventative Services, Men 65+
29.0%
Core Preventative Services, Women 65+
28.7%
Mammography Screening
79.2%
Hypertension Medication Adherence
76.4%
Reading Proficiency (K-2)
45%
Completed Some College
49.1%
Unemployment
12.5%
Children in Poverty
36.7%
Income Inequality
-0.06
Single Parent Households
15.8%
Violent Crime (per 10,000 people)
95.7
Injury Deaths (per 100,00 people)
68.6
Homicides (per 10,000 people)
1.7
Housing Code Violations (per 1,000 housing units)
164.1
Driving Alone to Work
50.8%
Commute ≥ 60 Minutes
14.1%
Walk Score™
79.0
Vacant Buildings
2.4%
Health Outcomes Rank39/46
Health Factors Rank 40/46

Population40,701
Median Age34.2
Median Household Income$26,259
Life Expectancy, Men
72.3
Life Expectancy, Women
79.3
Poor Physical Health
13.7%
Poor Mental Health
14.6%
Low Birth Weight
10.8%
Adult Asthma
10.9%
Hypertension
32.9%
High Cholesterol
34.6%
Cancer
5.6%
Chronic Kidney Disease
3.0%
Chronic Obstructive Pulmonary Disease (COPD)
7.2%
Coronary Heart Disease
6.3%
Diabetes
12.2%
Stroke
4.0%
Adult Smoking
22.2%
Adult Obesity
30.6%
Residents >1/2 Mile from Supermaket
22.3%
Physically Inactive Adults
30.6%
Binge Drinking
17.9%
Drug Overdose Deaths (per 100,000 people)
44.8
Teen Births (per 1,000 females 15-19)
26
Uninsured
12.0%
Primary Care Physician Supply (residents per physician)
1460
Inadequate Prenatal Care
30.7%
Recent Routine Medical Checkup, Adults
74.9%
Core Preventative Services, Men 65+
29.0%
Core Preventative Services, Women 65+
28.7%
Mammography Screening
79.2%
Hypertension Medication Adherence
76.4%
Reading Proficiency (K-2)
45%
Completed Some College
49.1%
Unemployment
12.5%
Children in Poverty
36.7%
Income Inequality
-0.06
Single Parent Households
15.8%
Violent Crime (per 10,000 people)
95.7
Injury Deaths (per 100,00 people)
68.6
Homicides (per 10,000 people)
1.7
Housing Code Violations (per 1,000 housing units)
164.1
Driving Alone to Work
50.8%
Commute ≥ 60 Minutes
14.1%
Walk Score™
79.0
Vacant Buildings
2.4%
Health Outcomes Rank5/46
Health Factors Rank 5/46

Population23,616
Median Age34.7
Median Household Income$62,326
Life Expectancy, Men
72.3
Life Expectancy, Women
79.3
Poor Physical Health
13.7%
Poor Mental Health
14.6%
Low Birth Weight
10.8%
Adult Asthma
10.9%
Hypertension
32.9%
High Cholesterol
34.6%
Cancer
5.6%
Chronic Kidney Disease
3.0%
Chronic Obstructive Pulmonary Disease (COPD)
7.2%
Coronary Heart Disease
6.3%
Diabetes
12.2%
Stroke
4.0%
Adult Smoking
22.2%
Adult Obesity
30.6%
Residents >1/2 Mile from Supermaket
22.3%
Physically Inactive Adults
30.6%
Binge Drinking
17.9%
Drug Overdose Deaths (per 100,000 people)
44.8
Teen Births (per 1,000 females 15-19)
26
Uninsured
12.0%
Primary Care Physician Supply (residents per physician)
1460
Inadequate Prenatal Care
30.7%
Recent Routine Medical Checkup, Adults
74.9%
Core Preventative Services, Men 65+
29.0%
Core Preventative Services, Women 65+
28.7%
Mammography Screening
79.2%
Hypertension Medication Adherence
76.4%
Reading Proficiency (K-2)
45%
Completed Some College
49.1%
Unemployment
12.5%
Children in Poverty
36.7%
Income Inequality
-0.06
Single Parent Households
15.8%
Violent Crime (per 10,000 people)
95.7
Injury Deaths (per 100,00 people)
68.6
Homicides (per 10,000 people)
1.7
Housing Code Violations (per 1,000 housing units)
164.1
Driving Alone to Work
50.8%
Commute ≥ 60 Minutes
14.1%
Walk Score™
79.0
Vacant Buildings
2.4%
Health Outcomes Rank33/46
Health Factors Rank 30/46

Population22,638
Median Age30.2
Median Household Income$19,968
Life Expectancy, Men
72.3
Life Expectancy, Women
79.3
Poor Physical Health
13.7%
Poor Mental Health
14.6%
Low Birth Weight
10.8%
Adult Asthma
10.9%
Hypertension
32.9%
High Cholesterol
34.6%
Cancer
5.6%
Chronic Kidney Disease
3.0%
Chronic Obstructive Pulmonary Disease (COPD)
7.2%
Coronary Heart Disease
6.3%
Diabetes
12.2%
Stroke
4.0%
Adult Smoking
22.2%
Adult Obesity
30.6%
Residents >1/2 Mile from Supermaket
22.3%
Physically Inactive Adults
30.6%
Binge Drinking
17.9%
Drug Overdose Deaths (per 100,000 people)
44.8
Teen Births (per 1,000 females 15-19)
26
Uninsured
12.0%
Primary Care Physician Supply (residents per physician)
1460
Inadequate Prenatal Care
30.7%
Recent Routine Medical Checkup, Adults
74.9%
Core Preventative Services, Men 65+
29.0%
Core Preventative Services, Women 65+
28.7%
Mammography Screening
79.2%
Hypertension Medication Adherence
76.4%
Reading Proficiency (K-2)
45%
Completed Some College
49.1%
Unemployment
12.5%
Children in Poverty
36.7%
Income Inequality
-0.06
Single Parent Households
15.8%
Violent Crime (per 10,000 people)
95.7
Injury Deaths (per 100,00 people)
68.6
Homicides (per 10,000 people)
1.7
Housing Code Violations (per 1,000 housing units)
164.1
Driving Alone to Work
50.8%
Commute ≥ 60 Minutes
14.1%
Walk Score™
79.0
Vacant Buildings
2.4%
Health Outcomes Rank12/46
Health Factors Rank 15/46

Population49,944
Median Age38.2
Median Household Income$50,142
Life Expectancy, Men
72.3
Life Expectancy, Women
79.3
Poor Physical Health
13.7%
Poor Mental Health
14.6%
Low Birth Weight
10.8%
Adult Asthma
10.9%
Hypertension
32.9%
High Cholesterol
34.6%
Cancer
5.6%
Chronic Kidney Disease
3.0%
Chronic Obstructive Pulmonary Disease (COPD)
7.2%
Coronary Heart Disease
6.3%
Diabetes
12.2%
Stroke
4.0%
Adult Smoking
22.2%
Adult Obesity
30.6%
Residents >1/2 Mile from Supermaket
22.3%
Physically Inactive Adults
30.6%
Binge Drinking
17.9%
Drug Overdose Deaths (per 100,000 people)
44.8
Teen Births (per 1,000 females 15-19)
26
Uninsured
12.0%
Primary Care Physician Supply (residents per physician)
1460
Inadequate Prenatal Care
30.7%
Recent Routine Medical Checkup, Adults
74.9%
Core Preventative Services, Men 65+
29.0%
Core Preventative Services, Women 65+
28.7%
Mammography Screening
79.2%
Hypertension Medication Adherence
76.4%
Reading Proficiency (K-2)
45%
Completed Some College
49.1%
Unemployment
12.5%
Children in Poverty
36.7%
Income Inequality
-0.06
Single Parent Households
15.8%
Violent Crime (per 10,000 people)
95.7
Injury Deaths (per 100,00 people)
68.6
Homicides (per 10,000 people)
1.7
Housing Code Violations (per 1,000 housing units)
164.1
Driving Alone to Work
50.8%
Commute ≥ 60 Minutes
14.1%
Walk Score™
79.0
Vacant Buildings
2.4%
Health Outcomes Rank21/46
Health Factors Rank 22/46

Population22,901
Median Age40.4
Median Household Income$51,423
Life Expectancy, Men
72.3
Life Expectancy, Women
79.3
Poor Physical Health
13.7%
Poor Mental Health
14.6%
Low Birth Weight
10.8%
Adult Asthma
10.9%
Hypertension
32.9%
High Cholesterol
34.6%
Cancer
5.6%
Chronic Kidney Disease
3.0%
Chronic Obstructive Pulmonary Disease (COPD)
7.2%
Coronary Heart Disease
6.3%
Diabetes
12.2%
Stroke
4.0%
Adult Smoking
22.2%
Adult Obesity
30.6%
Residents >1/2 Mile from Supermaket
22.3%
Physically Inactive Adults
30.6%
Binge Drinking
17.9%
Drug Overdose Deaths (per 100,000 people)
44.8
Teen Births (per 1,000 females 15-19)
26
Uninsured
12.0%
Primary Care Physician Supply (residents per physician)
1460
Inadequate Prenatal Care
30.7%
Recent Routine Medical Checkup, Adults
74.9%
Core Preventative Services, Men 65+
29.0%
Core Preventative Services, Women 65+
28.7%
Mammography Screening
79.2%
Hypertension Medication Adherence
76.4%
Reading Proficiency (K-2)
45%
Completed Some College
49.1%
Unemployment
12.5%
Children in Poverty
36.7%
Income Inequality
-0.06
Single Parent Households
15.8%
Violent Crime (per 10,000 people)
95.7
Injury Deaths (per 100,00 people)
68.6
Homicides (per 10,000 people)
1.7
Housing Code Violations (per 1,000 housing units)
164.1
Driving Alone to Work
50.8%
Commute ≥ 60 Minutes
14.1%
Walk Score™
79.0
Vacant Buildings
2.4%
Health Outcomes Rank3/46
Health Factors Rank 6/46

Population43,123
Median Age31.7
Median Household Income$71,366
Life Expectancy, Men
72.3
Life Expectancy, Women
79.3
Poor Physical Health
13.7%
Poor Mental Health
14.6%
Low Birth Weight
10.8%
Adult Asthma
10.9%
Hypertension
32.9%
High Cholesterol
34.6%
Cancer
5.6%
Chronic Kidney Disease
3.0%
Chronic Obstructive Pulmonary Disease (COPD)
7.2%
Coronary Heart Disease
6.3%
Diabetes
12.2%
Stroke
4.0%
Adult Smoking
22.2%
Adult Obesity
30.6%
Residents >1/2 Mile from Supermaket
22.3%
Physically Inactive Adults
30.6%
Binge Drinking
17.9%
Drug Overdose Deaths (per 100,000 people)
44.8
Teen Births (per 1,000 females 15-19)
26
Uninsured
12.0%
Primary Care Physician Supply (residents per physician)
1460
Inadequate Prenatal Care
30.7%
Recent Routine Medical Checkup, Adults
74.9%
Core Preventative Services, Men 65+
29.0%
Core Preventative Services, Women 65+
28.7%
Mammography Screening
79.2%
Hypertension Medication Adherence
76.4%
Reading Proficiency (K-2)
45%
Completed Some College
49.1%
Unemployment
12.5%
Children in Poverty
36.7%
Income Inequality
-0.06
Single Parent Households
15.8%
Violent Crime (per 10,000 people)
95.7
Injury Deaths (per 100,00 people)
68.6
Homicides (per 10,000 people)
1.7
Housing Code Violations (per 1,000 housing units)
164.1
Driving Alone to Work
50.8%
Commute ≥ 60 Minutes
14.1%
Walk Score™
79.0
Vacant Buildings
2.4%
Health Outcomes Rank18/46
Health Factors Rank 14/46

Population28,540
Median Age34.1
Median Household Income$54,257
Life Expectancy, Men
72.3
Life Expectancy, Women
79.3
Poor Physical Health
13.7%
Poor Mental Health
14.6%
Low Birth Weight
10.8%
Adult Asthma
10.9%
Hypertension
32.9%
High Cholesterol
34.6%
Cancer
5.6%
Chronic Kidney Disease
3.0%
Chronic Obstructive Pulmonary Disease (COPD)
7.2%
Coronary Heart Disease
6.3%
Diabetes
12.2%
Stroke
4.0%
Adult Smoking
22.2%
Adult Obesity
30.6%
Residents >1/2 Mile from Supermaket
22.3%
Physically Inactive Adults
30.6%
Binge Drinking
17.9%
Drug Overdose Deaths (per 100,000 people)
44.8
Teen Births (per 1,000 females 15-19)
26
Uninsured
12.0%
Primary Care Physician Supply (residents per physician)
1460
Inadequate Prenatal Care
30.7%
Recent Routine Medical Checkup, Adults
74.9%
Core Preventative Services, Men 65+
29.0%
Core Preventative Services, Women 65+
28.7%
Mammography Screening
79.2%
Hypertension Medication Adherence
76.4%
Reading Proficiency (K-2)
45%
Completed Some College
49.1%
Unemployment
12.5%
Children in Poverty
36.7%
Income Inequality
-0.06
Single Parent Households
15.8%
Violent Crime (per 10,000 people)
95.7
Injury Deaths (per 100,00 people)
68.6
Homicides (per 10,000 people)
1.7
Housing Code Violations (per 1,000 housing units)
164.1
Driving Alone to Work
50.8%
Commute ≥ 60 Minutes
14.1%
Walk Score™
79.0
Vacant Buildings
2.4%
Health Outcomes Rank40/46
Health Factors Rank 37/46

Population21,816
Median Age33.1
Median Household Income$19,750
Life Expectancy, Men
72.3
Life Expectancy, Women
79.3
Poor Physical Health
13.7%
Poor Mental Health
14.6%
Low Birth Weight
10.8%
Adult Asthma
10.9%
Hypertension
32.9%
High Cholesterol
34.6%
Cancer
5.6%
Chronic Kidney Disease
3.0%
Chronic Obstructive Pulmonary Disease (COPD)
7.2%
Coronary Heart Disease
6.3%
Diabetes
12.2%
Stroke
4.0%
Adult Smoking
22.2%
Adult Obesity
30.6%
Residents >1/2 Mile from Supermaket
22.3%
Physically Inactive Adults
30.6%
Binge Drinking
17.9%
Drug Overdose Deaths (per 100,000 people)
44.8
Teen Births (per 1,000 females 15-19)
26
Uninsured
12.0%
Primary Care Physician Supply (residents per physician)
1460
Inadequate Prenatal Care
30.7%
Recent Routine Medical Checkup, Adults
74.9%
Core Preventative Services, Men 65+
29.0%
Core Preventative Services, Women 65+
28.7%
Mammography Screening
79.2%
Hypertension Medication Adherence
76.4%
Reading Proficiency (K-2)
45%
Completed Some College
49.1%
Unemployment
12.5%
Children in Poverty
36.7%
Income Inequality
-0.06
Single Parent Households
15.8%
Violent Crime (per 10,000 people)
95.7
Injury Deaths (per 100,00 people)
68.6
Homicides (per 10,000 people)
1.7
Housing Code Violations (per 1,000 housing units)
164.1
Driving Alone to Work
50.8%
Commute ≥ 60 Minutes
14.1%
Walk Score™
79.0
Vacant Buildings
2.4%
Health Outcomes Rank23/46
Health Factors Rank 29/46

Population31,685
Median Age34.4
Median Household Income$43,970
Life Expectancy, Men
72.3
Life Expectancy, Women
79.3
Poor Physical Health
13.7%
Poor Mental Health
14.6%
Low Birth Weight
10.8%
Adult Asthma
10.9%
Hypertension
32.9%
High Cholesterol
34.6%
Cancer
5.6%
Chronic Kidney Disease
3.0%
Chronic Obstructive Pulmonary Disease (COPD)
7.2%
Coronary Heart Disease
6.3%
Diabetes
12.2%
Stroke
4.0%
Adult Smoking
22.2%
Adult Obesity
30.6%
Residents >1/2 Mile from Supermaket
22.3%
Physically Inactive Adults
30.6%
Binge Drinking
17.9%
Drug Overdose Deaths (per 100,000 people)
44.8
Teen Births (per 1,000 females 15-19)
26
Uninsured
12.0%
Primary Care Physician Supply (residents per physician)
1460
Inadequate Prenatal Care
30.7%
Recent Routine Medical Checkup, Adults
74.9%
Core Preventative Services, Men 65+
29.0%
Core Preventative Services, Women 65+
28.7%
Mammography Screening
79.2%
Hypertension Medication Adherence
76.4%
Reading Proficiency (K-2)
45%
Completed Some College
49.1%
Unemployment
12.5%
Children in Poverty
36.7%
Income Inequality
-0.06
Single Parent Households
15.8%
Violent Crime (per 10,000 people)
95.7
Injury Deaths (per 100,00 people)
68.6
Homicides (per 10,000 people)
1.7
Housing Code Violations (per 1,000 housing units)
164.1
Driving Alone to Work
50.8%
Commute ≥ 60 Minutes
14.1%
Walk Score™
79.0
Vacant Buildings
2.4%
Health Outcomes Rank10/46
Health Factors Rank 9/46

Population33,019
Median Age43.8
Median Household Income$53,731
Life Expectancy, Men
72.3
Life Expectancy, Women
79.3
Poor Physical Health
13.7%
Poor Mental Health
14.6%
Low Birth Weight
10.8%
Adult Asthma
10.9%
Hypertension
32.9%
High Cholesterol
34.6%
Cancer
5.6%
Chronic Kidney Disease
3.0%
Chronic Obstructive Pulmonary Disease (COPD)
7.2%
Coronary Heart Disease
6.3%
Diabetes
12.2%
Stroke
4.0%
Adult Smoking
22.2%
Adult Obesity
30.6%
Residents >1/2 Mile from Supermaket
22.3%
Physically Inactive Adults
30.6%
Binge Drinking
17.9%
Drug Overdose Deaths (per 100,000 people)
44.8
Teen Births (per 1,000 females 15-19)
26
Uninsured
12.0%
Primary Care Physician Supply (residents per physician)
1460
Inadequate Prenatal Care
30.7%
Recent Routine Medical Checkup, Adults
74.9%
Core Preventative Services, Men 65+
29.0%
Core Preventative Services, Women 65+
28.7%
Mammography Screening
79.2%
Hypertension Medication Adherence
76.4%
Reading Proficiency (K-2)
45%
Completed Some College
49.1%
Unemployment
12.5%
Children in Poverty
36.7%
Income Inequality
-0.06
Single Parent Households
15.8%
Violent Crime (per 10,000 people)
95.7
Injury Deaths (per 100,00 people)
68.6
Homicides (per 10,000 people)
1.7
Housing Code Violations (per 1,000 housing units)
164.1
Driving Alone to Work
50.8%
Commute ≥ 60 Minutes
14.1%
Walk Score™
79.0
Vacant Buildings
2.4%
Health Outcomes Rank13/46
Health Factors Rank 17/46

Population31,408
Median Age38.3
Median Household Income$41,334
Life Expectancy, Men
72.3
Life Expectancy, Women
79.3
Poor Physical Health
13.7%
Poor Mental Health
14.6%
Low Birth Weight
10.8%
Adult Asthma
10.9%
Hypertension
32.9%
High Cholesterol
34.6%
Cancer
5.6%
Chronic Kidney Disease
3.0%
Chronic Obstructive Pulmonary Disease (COPD)
7.2%
Coronary Heart Disease
6.3%
Diabetes
12.2%
Stroke
4.0%
Adult Smoking
22.2%
Adult Obesity
30.6%
Residents >1/2 Mile from Supermaket
22.3%
Physically Inactive Adults
30.6%
Binge Drinking
17.9%
Drug Overdose Deaths (per 100,000 people)
44.8
Teen Births (per 1,000 females 15-19)
26
Uninsured
12.0%
Primary Care Physician Supply (residents per physician)
1460
Inadequate Prenatal Care
30.7%
Recent Routine Medical Checkup, Adults
74.9%
Core Preventative Services, Men 65+
29.0%
Core Preventative Services, Women 65+
28.7%
Mammography Screening
79.2%
Hypertension Medication Adherence
76.4%
Reading Proficiency (K-2)
45%
Completed Some College
49.1%
Unemployment
12.5%
Children in Poverty
36.7%
Income Inequality
-0.06
Single Parent Households
15.8%
Violent Crime (per 10,000 people)
95.7
Injury Deaths (per 100,00 people)
68.6
Homicides (per 10,000 people)
1.7
Housing Code Violations (per 1,000 housing units)
164.1
Driving Alone to Work
50.8%
Commute ≥ 60 Minutes
14.1%
Walk Score™
79.0
Vacant Buildings
2.4%
Health Outcomes Rank6/46
Health Factors Rank 12/46

Population30,461
Median Age36.1
Median Household Income$51,205
Life Expectancy, Men
72.3
Life Expectancy, Women
79.3
Poor Physical Health
13.7%
Poor Mental Health
14.6%
Low Birth Weight
10.8%
Adult Asthma
10.9%
Hypertension
32.9%
High Cholesterol
34.6%
Cancer
5.6%
Chronic Kidney Disease
3.0%
Chronic Obstructive Pulmonary Disease (COPD)
7.2%
Coronary Heart Disease
6.3%
Diabetes
12.2%
Stroke
4.0%
Adult Smoking
22.2%
Adult Obesity
30.6%
Residents >1/2 Mile from Supermaket
22.3%
Physically Inactive Adults
30.6%
Binge Drinking
17.9%
Drug Overdose Deaths (per 100,000 people)
44.8
Teen Births (per 1,000 females 15-19)
26
Uninsured
12.0%
Primary Care Physician Supply (residents per physician)
1460
Inadequate Prenatal Care
30.7%
Recent Routine Medical Checkup, Adults
74.9%
Core Preventative Services, Men 65+
29.0%
Core Preventative Services, Women 65+
28.7%
Mammography Screening
79.2%
Hypertension Medication Adherence
76.4%
Reading Proficiency (K-2)
45%
Completed Some College
49.1%
Unemployment
12.5%
Children in Poverty
36.7%
Income Inequality
-0.06
Single Parent Households
15.8%
Violent Crime (per 10,000 people)
95.7
Injury Deaths (per 100,00 people)
68.6
Homicides (per 10,000 people)
1.7
Housing Code Violations (per 1,000 housing units)
164.1
Driving Alone to Work
50.8%
Commute ≥ 60 Minutes
14.1%
Walk Score™
79.0
Vacant Buildings
2.4%
Health Outcomes Rank44/46
Health Factors Rank 42/46

Population32,617
Median Age33.2
Median Household Income$20,939
Life Expectancy, Men
72.3
Life Expectancy, Women
79.3
Poor Physical Health
13.7%
Poor Mental Health
14.6%
Low Birth Weight
10.8%
Adult Asthma
10.9%
Hypertension
32.9%
High Cholesterol
34.6%
Cancer
5.6%
Chronic Kidney Disease
3.0%
Chronic Obstructive Pulmonary Disease (COPD)
7.2%
Coronary Heart Disease
6.3%
Diabetes
12.2%
Stroke
4.0%
Adult Smoking
22.2%
Adult Obesity
30.6%
Residents >1/2 Mile from Supermaket
22.3%
Physically Inactive Adults
30.6%
Binge Drinking
17.9%
Drug Overdose Deaths (per 100,000 people)
44.8
Teen Births (per 1,000 females 15-19)
26
Uninsured
12.0%
Primary Care Physician Supply (residents per physician)
1460
Inadequate Prenatal Care
30.7%
Recent Routine Medical Checkup, Adults
74.9%
Core Preventative Services, Men 65+
29.0%
Core Preventative Services, Women 65+
28.7%
Mammography Screening
79.2%
Hypertension Medication Adherence
76.4%
Reading Proficiency (K-2)
45%
Completed Some College
49.1%
Unemployment
12.5%
Children in Poverty
36.7%
Income Inequality
-0.06
Single Parent Households
15.8%
Violent Crime (per 10,000 people)
95.7
Injury Deaths (per 100,00 people)
68.6
Homicides (per 10,000 people)
1.7
Housing Code Violations (per 1,000 housing units)
164.1
Driving Alone to Work
50.8%
Commute ≥ 60 Minutes
14.1%
Walk Score™
79.0
Vacant Buildings
2.4%
Health Outcomes Rank16/46
Health Factors Rank 11/46

Population43,452
Median Age39.9
Median Household Income$58,198
Life Expectancy, Men
72.3
Life Expectancy, Women
79.3
Poor Physical Health
13.7%
Poor Mental Health
14.6%
Low Birth Weight
10.8%
Adult Asthma
10.9%
Hypertension
32.9%
High Cholesterol
34.6%
Cancer
5.6%
Chronic Kidney Disease
3.0%
Chronic Obstructive Pulmonary Disease (COPD)
7.2%
Coronary Heart Disease
6.3%
Diabetes
12.2%
Stroke
4.0%
Adult Smoking
22.2%
Adult Obesity
30.6%
Residents >1/2 Mile from Supermaket
22.3%
Physically Inactive Adults
30.6%
Binge Drinking
17.9%
Drug Overdose Deaths (per 100,000 people)
44.8
Teen Births (per 1,000 females 15-19)
26
Uninsured
12.0%
Primary Care Physician Supply (residents per physician)
1460
Inadequate Prenatal Care
30.7%
Recent Routine Medical Checkup, Adults
74.9%
Core Preventative Services, Men 65+
29.0%
Core Preventative Services, Women 65+
28.7%
Mammography Screening
79.2%
Hypertension Medication Adherence
76.4%
Reading Proficiency (K-2)
45%
Completed Some College
49.1%
Unemployment
12.5%
Children in Poverty
36.7%
Income Inequality
-0.06
Single Parent Households
15.8%
Violent Crime (per 10,000 people)
95.7
Injury Deaths (per 100,00 people)
68.6
Homicides (per 10,000 people)
1.7
Housing Code Violations (per 1,000 housing units)
164.1
Driving Alone to Work
50.8%
Commute ≥ 60 Minutes
14.1%
Walk Score™
79.0
Vacant Buildings
2.4%
Health Outcomes Rank15/46
Health Factors Rank 10/46

Population40,676
Median Age40.4
Median Household Income$53,331
Life Expectancy, Men
72.3
Life Expectancy, Women
79.3
Poor Physical Health
13.7%
Poor Mental Health
14.6%
Low Birth Weight
10.8%
Adult Asthma
10.9%
Hypertension
32.9%
High Cholesterol
34.6%
Cancer
5.6%
Chronic Kidney Disease
3.0%
Chronic Obstructive Pulmonary Disease (COPD)
7.2%
Coronary Heart Disease
6.3%
Diabetes
12.2%
Stroke
4.0%
Adult Smoking
22.2%
Adult Obesity
30.6%
Residents >1/2 Mile from Supermaket
22.3%
Physically Inactive Adults
30.6%
Binge Drinking
17.9%
Drug Overdose Deaths (per 100,000 people)
44.8
Teen Births (per 1,000 females 15-19)
26
Uninsured
12.0%
Primary Care Physician Supply (residents per physician)
1460
Inadequate Prenatal Care
30.7%
Recent Routine Medical Checkup, Adults
74.9%
Core Preventative Services, Men 65+
29.0%
Core Preventative Services, Women 65+
28.7%
Mammography Screening
79.2%
Hypertension Medication Adherence
76.4%
Reading Proficiency (K-2)
45%
Completed Some College
49.1%
Unemployment
12.5%
Children in Poverty
36.7%
Income Inequality
-0.06
Single Parent Households
15.8%
Violent Crime (per 10,000 people)
95.7
Injury Deaths (per 100,00 people)
68.6
Homicides (per 10,000 people)
1.7
Housing Code Violations (per 1,000 housing units)
164.1
Driving Alone to Work
50.8%
Commute ≥ 60 Minutes
14.1%
Walk Score™
79.0
Vacant Buildings
2.4%
Health Outcomes Rank4/46
Health Factors Rank 8/46

Population46,664
Median Age28.5
Median Household Income$36,185
Life Expectancy, Men
72.3
Life Expectancy, Women
79.3
Poor Physical Health
13.7%
Poor Mental Health
14.6%
Low Birth Weight
10.8%
Adult Asthma
10.9%
Hypertension
32.9%
High Cholesterol
34.6%
Cancer
5.6%
Chronic Kidney Disease
3.0%
Chronic Obstructive Pulmonary Disease (COPD)
7.2%
Coronary Heart Disease
6.3%
Diabetes
12.2%
Stroke
4.0%
Adult Smoking
22.2%
Adult Obesity
30.6%
Residents >1/2 Mile from Supermaket
22.3%
Physically Inactive Adults
30.6%
Binge Drinking
17.9%
Drug Overdose Deaths (per 100,000 people)
44.8
Teen Births (per 1,000 females 15-19)
26
Uninsured
12.0%
Primary Care Physician Supply (residents per physician)
1460
Inadequate Prenatal Care
30.7%
Recent Routine Medical Checkup, Adults
74.9%
Core Preventative Services, Men 65+
29.0%
Core Preventative Services, Women 65+
28.7%
Mammography Screening
79.2%
Hypertension Medication Adherence
76.4%
Reading Proficiency (K-2)
45%
Completed Some College
49.1%
Unemployment
12.5%
Children in Poverty
36.7%
Income Inequality
-0.06
Single Parent Households
15.8%
Violent Crime (per 10,000 people)
95.7
Injury Deaths (per 100,00 people)
68.6
Homicides (per 10,000 people)
1.7
Housing Code Violations (per 1,000 housing units)
164.1
Driving Alone to Work
50.8%
Commute ≥ 60 Minutes
14.1%
Walk Score™
79.0
Vacant Buildings
2.4%
Health Outcomes Rank46/46
Health Factors Rank 46/46

Population22,960
Median Age27.7
Median Household Income$24,504
Life Expectancy, Men
72.3
Life Expectancy, Women
79.3
Poor Physical Health
13.7%
Poor Mental Health
14.6%
Low Birth Weight
10.8%
Adult Asthma
10.9%
Hypertension
32.9%
High Cholesterol
34.6%
Cancer
5.6%
Chronic Kidney Disease
3.0%
Chronic Obstructive Pulmonary Disease (COPD)
7.2%
Coronary Heart Disease
6.3%
Diabetes
12.2%
Stroke
4.0%
Adult Smoking
22.2%
Adult Obesity
30.6%
Residents >1/2 Mile from Supermaket
22.3%
Physically Inactive Adults
30.6%
Binge Drinking
17.9%
Drug Overdose Deaths (per 100,000 people)
44.8
Teen Births (per 1,000 females 15-19)
26
Uninsured
12.0%
Primary Care Physician Supply (residents per physician)
1460
Inadequate Prenatal Care
30.7%
Recent Routine Medical Checkup, Adults
74.9%
Core Preventative Services, Men 65+
29.0%
Core Preventative Services, Women 65+
28.7%
Mammography Screening
79.2%
Hypertension Medication Adherence
76.4%
Reading Proficiency (K-2)
45%
Completed Some College
49.1%
Unemployment
12.5%
Children in Poverty
36.7%
Income Inequality
-0.06
Single Parent Households
15.8%
Violent Crime (per 10,000 people)
95.7
Injury Deaths (per 100,00 people)
68.6
Homicides (per 10,000 people)
1.7
Housing Code Violations (per 1,000 housing units)
164.1
Driving Alone to Work
50.8%
Commute ≥ 60 Minutes
14.1%
Walk Score™
79.0
Vacant Buildings
2.4%
Health Outcomes Rank30/46
Health Factors Rank 18/46

Population39,272
Median Age41.3
Median Household Income$42,149
Life Expectancy, Men
72.3
Life Expectancy, Women
79.3
Poor Physical Health
13.7%
Poor Mental Health
14.6%
Low Birth Weight
10.8%
Adult Asthma
10.9%
Hypertension
32.9%
High Cholesterol
34.6%
Cancer
5.6%
Chronic Kidney Disease
3.0%
Chronic Obstructive Pulmonary Disease (COPD)
7.2%
Coronary Heart Disease
6.3%
Diabetes
12.2%
Stroke
4.0%
Adult Smoking
22.2%
Adult Obesity
30.6%
Residents >1/2 Mile from Supermaket
22.3%
Physically Inactive Adults
30.6%
Binge Drinking
17.9%
Drug Overdose Deaths (per 100,000 people)
44.8
Teen Births (per 1,000 females 15-19)
26
Uninsured
12.0%
Primary Care Physician Supply (residents per physician)
1460
Inadequate Prenatal Care
30.7%
Recent Routine Medical Checkup, Adults
74.9%
Core Preventative Services, Men 65+
29.0%
Core Preventative Services, Women 65+
28.7%
Mammography Screening
79.2%
Hypertension Medication Adherence
76.4%
Reading Proficiency (K-2)
45%
Completed Some College
49.1%
Unemployment
12.5%
Children in Poverty
36.7%
Income Inequality
-0.06
Single Parent Households
15.8%
Violent Crime (per 10,000 people)
95.7
Injury Deaths (per 100,00 people)
68.6
Homicides (per 10,000 people)
1.7
Housing Code Violations (per 1,000 housing units)
164.1
Driving Alone to Work
50.8%
Commute ≥ 60 Minutes
14.1%
Walk Score™
79.0
Vacant Buildings
2.4%
Health Outcomes Rank27/46
Health Factors Rank 33/46

Population36,854
Median Age34.1
Median Household Income$40,820
Life Expectancy, Men
72.3
Life Expectancy, Women
79.3
Poor Physical Health
13.7%
Poor Mental Health
14.6%
Low Birth Weight
10.8%
Adult Asthma
10.9%
Hypertension
32.9%
High Cholesterol
34.6%
Cancer
5.6%
Chronic Kidney Disease
3.0%
Chronic Obstructive Pulmonary Disease (COPD)
7.2%
Coronary Heart Disease
6.3%
Diabetes
12.2%
Stroke
4.0%
Adult Smoking
22.2%
Adult Obesity
30.6%
Residents >1/2 Mile from Supermaket
22.3%
Physically Inactive Adults
30.6%
Binge Drinking
17.9%
Drug Overdose Deaths (per 100,000 people)
44.8
Teen Births (per 1,000 females 15-19)
26
Uninsured
12.0%
Primary Care Physician Supply (residents per physician)
1460
Inadequate Prenatal Care
30.7%
Recent Routine Medical Checkup, Adults
74.9%
Core Preventative Services, Men 65+
29.0%
Core Preventative Services, Women 65+
28.7%
Mammography Screening
79.2%
Hypertension Medication Adherence
76.4%
Reading Proficiency (K-2)
45%
Completed Some College
49.1%
Unemployment
12.5%
Children in Poverty
36.7%
Income Inequality
-0.06
Single Parent Households
15.8%
Violent Crime (per 10,000 people)
95.7
Injury Deaths (per 100,00 people)
68.6
Homicides (per 10,000 people)
1.7
Housing Code Violations (per 1,000 housing units)
164.1
Driving Alone to Work
50.8%
Commute ≥ 60 Minutes
14.1%
Walk Score™
79.0
Vacant Buildings
2.4%